

Currently Empty: ₹0.00



Uncategorized
What Is Data Analytics? A Beginner’s Guide to a High-Demand Career in 2026
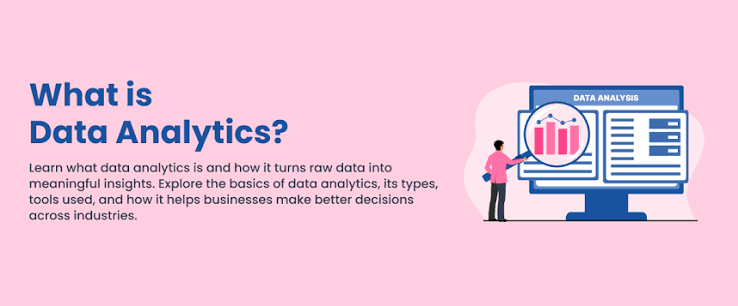
In our increasingly digital world, a massive explosion of information is transforming how we live, work, and make decisions. Every time you stream a movie, swipe a credit card, browse a retail website, or log your daily steps on a fitness tracker, you generate digital footprints. On their own, these footprints are just an overwhelming sea of numbers and text. However, when properly collected, organized, and evaluated, they become one of the most valuable resources on earth.
But what exactly is data analytics, and why has it suddenly become one of the fastest-growing fields of the 21st century? This comprehensive beginner’s guide explores the core fundamentals of data analytics, details the specific tasks professionals complete daily, outlines the essential technical and soft skills required to break into the industry, and explains why this field offers such an exceptionally lucrative, future-proof career path.
Table of Contents
Defining the Core Concept: What Is Data Analytics?
At its simplest, data analytics is the science of analyzing raw data to find trends, answer critical questions, and draw meaningful conclusions. It is a systematic process that converts disorganized, messy facts into structured, actionable insights that help businesses, government agencies, and non-profit organizations optimize their performance.
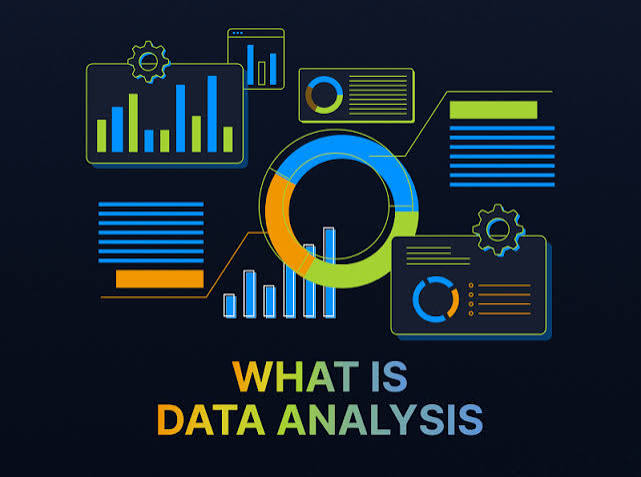
Many people confuse data analytics with broader terms like data science or data engineering. While these fields are closely related and frequently overlap, they have distinct focuses:
- Data Engineering: Focuses on building the structural pipelines, databases, and architectures that capture and store information safely.
- Data Science: Focuses on using advanced machine learning, predictive modeling, and open-ended algorithms to anticipate long-term future possibilities.
- Data Analytics: Focuses on examining existing datasets to solve specific business problems, optimize current operations, and answer concrete, practical questions.
Think of a data engineer as someone who builds the highway system, a data scientist as an engineer designing autonomous vehicles to run on that highway, and a practitioner of data analytics as the expert driver who navigates the highway to deliver valuable goods to a specific destination.
Importance of Data Analytics in Business’s Today
Modern businesses no longer rely on gut feelings, intuition, or historical guesswork to make critical financial decisions. By analyzing customer behaviors, supply chains, and market shifts, companies can make informed, evidence-based choices by data analytics.
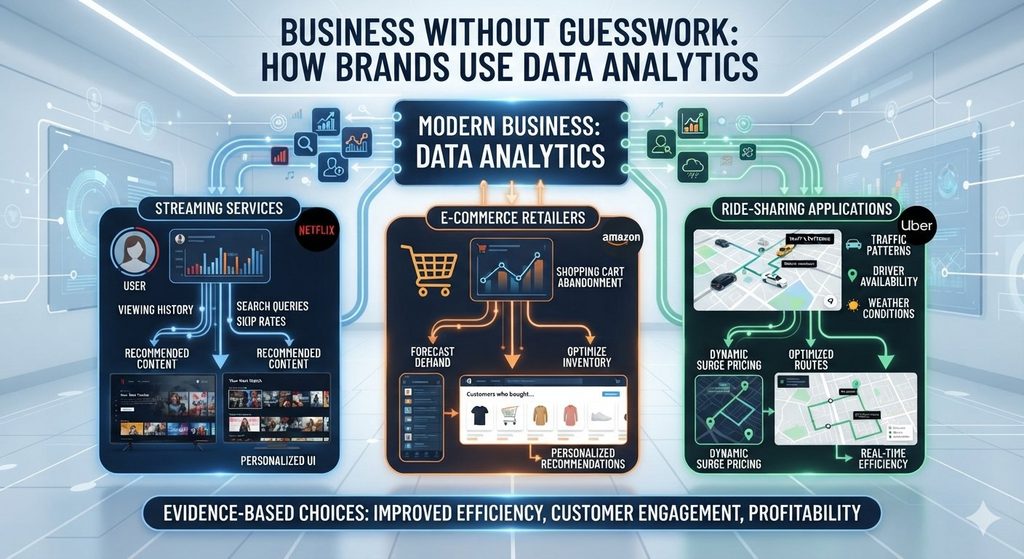
Consider how major global brands successfully apply data analytics every single day:
- Streaming Services: Platforms like Netflix track your viewing history, pause points, search queries, and skip rates. They use data analytics to recommend personalized content, keeping users engaged for longer periods.
- E-commerce Retailers: Amazon monitors your browsing habits, shopping cart abandonment rates, and seasonal purchases. Through target data analytics, they forecast consumer demand, manage inventory levels, and serve highly personalized product recommendations.
- Ride-Sharing Applications: Companies like Uber analyze local traffic patterns, weather conditions, driver availability, and historical ride data in real time. They deploy data analytics to determine dynamic surge pricing and calculate the fastest routes for drivers.
Without effective data analytics, companies are essentially operating in the dark, risking capital on unproven assumptions while their data-driven competitors capture market share.
Exploring the Four Pillars of Data Analytics
To fully understand the field of data analytics, you must explore the four distinct types of analysis that professionals utilize. These four pillars represent a progression, where each stage adds more business value but requires more sophisticated tools and expertise.
1. Descriptive Analytics: What Happened?
Descriptive analytics is the foundation of all analysis. It looks backward at historical data to summarize what has already taken place within an organization. It simplifies massive datasets into easily readable reports, dashboards, and historical overviews.
Examples of descriptive analytics include monthly sales revenue charts, annual website traffic reports, year-over-year customer retention rates, and inventory summaries.
2. Diagnostic Analytics: Why Did It Happen?
Once you understand what happened, the next logical step is to uncover why it happened. Diagnostic analytics dives much deeper into the historical data to find anomalies, isolate specific variables, and discover clear causal relationships.
For instance, if descriptive analytics reveals a sudden 20% drop in website sales during the month of October, a practitioner uses diagnostic analytics to investigate the root cause. They might find that a specific website update caused a checkout page error on mobile devices, or that a competitor launched a massive discount campaign at the exact same time.
3. Predictive Analytics: What’s Going to happen Next?
Businesses use predictive analytics to forecast future sales revenue, anticipate seasonal spikes in customer service calls, identify credit card fraud before it occurs, or determine which customers are at a high risk of canceling their subscriptions. While it cannot predict the future with absolute certainty, it provides highly accurate probabilities.
4. Prescriptive Analytics: Which Actions to Follow?
Prescriptive analytics represents the highest level of data maturity. It does not just stop at predicting what will happen; it actively recommends the specific steps an organization should take to capitalize on a future opportunity or mitigate a looming risk.
This type of analysis relies heavily on complex automated systems, machine learning algorithms, and intensive business simulation models. A common real-world example is Google Maps using live traffic data to automatically recalculate and recommend an alternative driving route to save you fifteen minutes on your evening commute.
Step-by-Step: The Standard Data Analytics Lifecycle
A successful project does not happen by accident. Professionals follow a structured lifecycle to ensure their conclusions are accurate, reliable, and completely aligned with organizational goals. The standard data analytics lifecycle consists of five key steps.
Step 1: Defining the Core Business Question
Every analytics project must begin with a clear, well-defined problem or objective. Analysts must collaborate closely with business leaders to understand what they are trying to achieve. An unfocused question like “How can we make more money?” is too vague. Instead, analysts refine it into a highly specific question, such as: “Which marketing channel has the highest customer acquisition cost, and how can we optimize our budget to increase conversions?”
Step 2: Data Collection and Gathering
Once the question is defined, the analyst identifies and gathers the necessary raw information. This data can come from a wide variety of sources, including internal corporate databases, customer relationship management (CRM) software, website tracking cookies, social media interactions, public government registries, or third-party market research surveys.
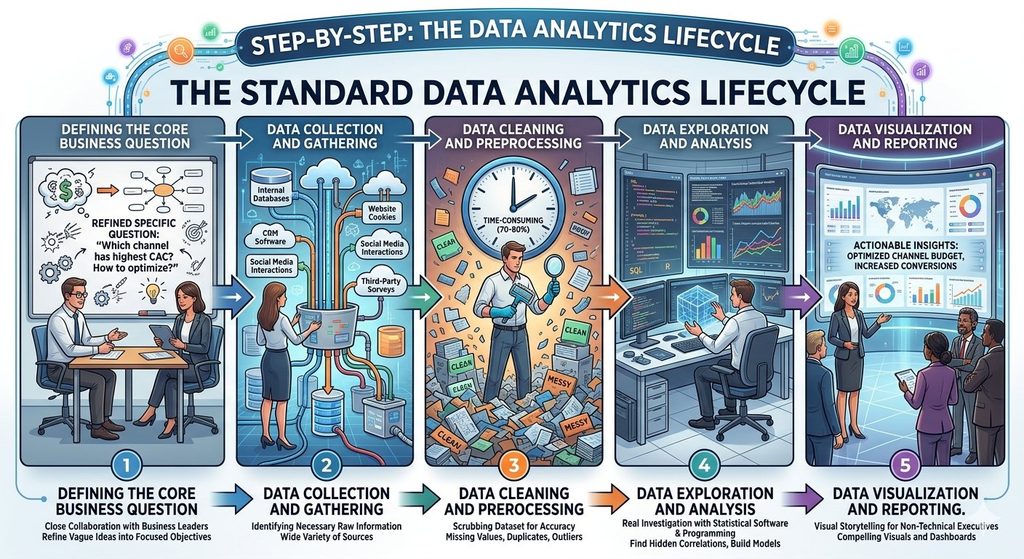
Step 3: Data Cleaning and Preprocessing
Raw data is notoriously messy, inconsistent, and full of errors. It frequently contains missing values, duplicate entries, formatting inconsistencies, and obvious outliers. Data cleaning is often the most time-consuming phase of the lifecycle, sometimes taking up to 70% to 80% of an analyst’s total time. Analysts must systematically scrub the dataset to ensure that the information is clean, reliable, and standardized before any actual analysis begins.
Step 4: Data Exploration and Analysis
With a clean dataset in hand, the real investigation begins. Analysts use statistical software, database queries, and specialized programming languages to slice, dice, filter, and manipulate the information. They look for hidden correlations, calculate averages, isolate trends over time, and build models that answer the primary business questions established in the first step.
Step 5: Data Visualization and Reporting
The final step is translating complex technical findings into a format that non-technical business executives can easily understand and act upon. Analysts create visual charts, interactive graphs, and comprehensive dashboards that tell a compelling story. A brilliant statistical finding is useless if the company’s stakeholders cannot comprehend it, making clear communication and visual storytelling absolutely vital.
Key Technical Tools and Skills for Beginners
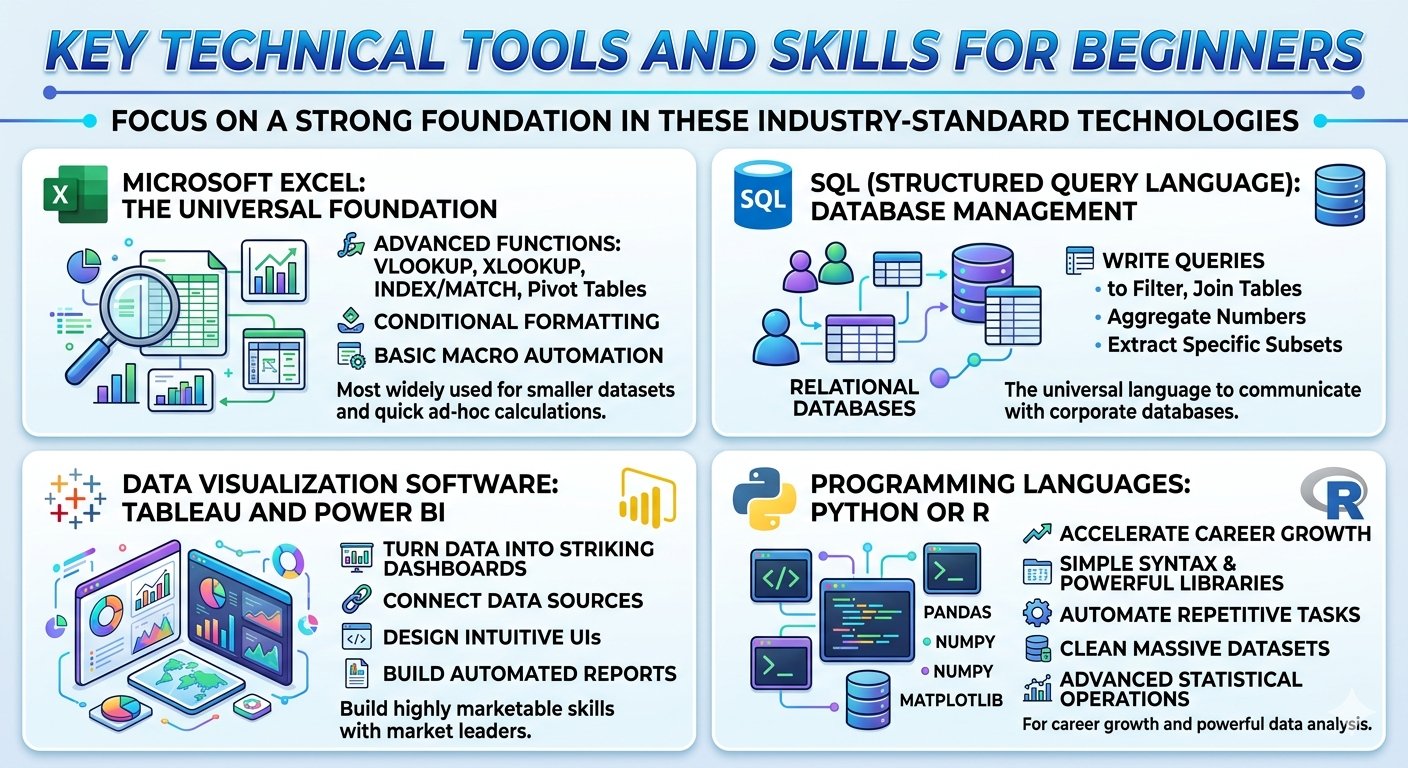
If you are looking to build a career in this field, you do not need to master every single tool overnight. Instead, focus on building a strong foundation in a few industry-standard technologies that form the backbone of modern data analytics.
Microsoft Excel: The Universal Foundation
Do not underestimate the power of Microsoft Excel. It remains the most widely used tool in corporate offices worldwide. As a beginner, you must master advanced Excel functions such as VLOOKUP, XLOOKUP, INDEX/MATCH, Pivot Tables, Conditional Formatting, and basic macro automation. Excel is perfect for handling smaller datasets and performing quick, ad-hoc calculations.
SQL (Structured Query Language): Database Management
Most corporate data does not live in flat Excel files; it is stored in massive, relational databases. SQL is the universal language used to communicate with, query, and extract data from these databases. To be a competitive job applicant, you must know how to write SQL queries to filter data, join multiple tables together, aggregate numbers, and extract specific subsets of information.
Data Visualization Software: Tableau and Power BI
Data visualization tools allow you to turn rows of text and numbers into striking, interactive dashboards. Tableau and Microsoft Power BI are the two undisputed market leaders in this category. Learning how to connect data sources to these tools, design intuitive user interfaces, and build automated reports is a highly marketable skill that employers actively seek.
Programming Languages: Python or R
While not always strictly required for absolute entry-level roles, learning a programming language like Python or R will dramatically accelerate your career growth. Python is incredibly popular due to its simple, highly readable syntax and its powerful data-specific libraries, such as Pandas, NumPy, and Matplotlib. Programming allows you to automate repetitive tasks, clean massive datasets that would crash Excel, and perform advanced statistical operations.
Crucial Soft Skills for Analytical Success
While technical tools are essential, they only represent half of the equation. The best professionals are not just math experts or coding wizards; they are well-rounded individuals who possess strong soft skills that allow them to bridge the gap between technical data and human business strategy.
Analytical Thinking and Problem-Solving
You must possess a natural curiosity and a desire to solve complex puzzles. A great analyst does not just look at a chart and accept it at face value; they constantly ask questions, challenge assumptions, look for hidden variables, and dig deeper to uncover the underlying truth.
Effective Communication and Storytelling
An analyst spends a significant amount of time presenting findings to managers, clients, and executives who may not understand complex statistics or programming languages. You must be able to explain intricate technical concepts in plain, simple, and persuasive language. You need to connect the numbers directly to real-world business outcomes.
Business Acumen and Domain Knowledge
To provide valuable insights, you must take the time to thoroughly understand the specific industry you are working in. Whether it is healthcare, e-commerce, real estate, or finance, you need to know how the business generates revenue, what its main operational costs are, who its target audience is, and what its primary challenges are.
Career Outlook: Why Data Analytics Is a High-Demand Field
Choosing to pursue a career in this industry is a remarkably secure and lucrative decision. The demand for qualified professionals continues to vastly outpace the available supply of talent, creating an excellent job market for entry-level applicants.
Unprecedented Job Growth and Openings
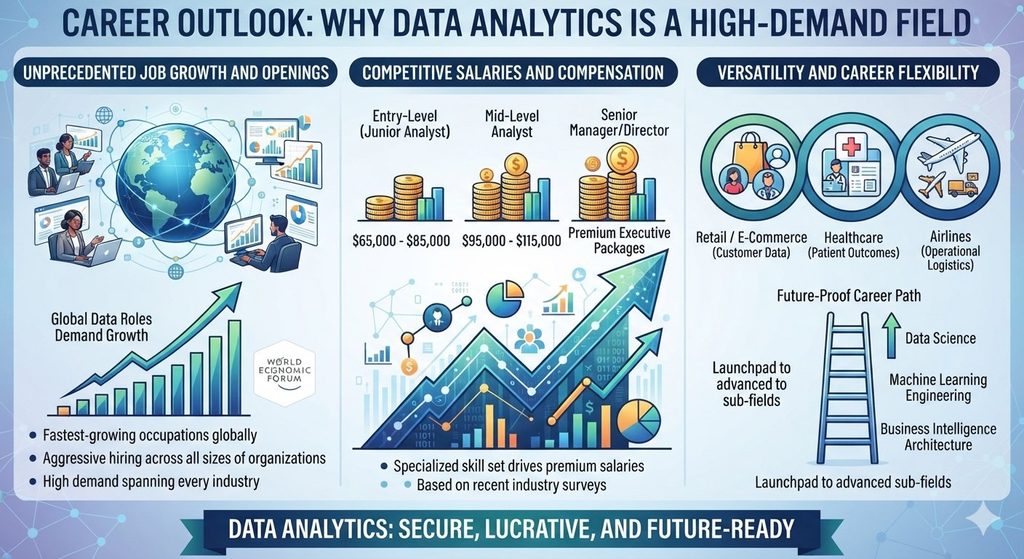
The World Economic Forum consistently ranks data-related roles among the fastest-growing occupations globally. As organizations of all sizes realize that they must become data-driven to survive, they are aggressively hiring professionals to help them manage and interpret their information. This high demand spans across almost every single industry imaginable.
Competitive Salaries and Compensation
Because the skill set is specialized and highly valuable to a company’s bottom line, organizations are willing to pay premium salaries to secure top talent. According to recent industry salary surveys, the median entry-level salary for a junior analyst in the United States routinely ranges from $65,000 to $85,000 per year. With just a few years of experience, mid-level analysts can easily earn over $95,000 to $115,000 annually, while senior managers and directors command much higher executive packages.
Versatility and Career Flexibility
One of the greatest benefits of this career path is its incredible versatility. Because every industry generates data, you are never locked into a single sector. You can easily transition from analyzing customer data at a fashion retailer to analyzing patient outcomes at a major hospital network, or optimizing operational logistics at an international airline.
Furthermore, a solid background in analytics serves as a perfect launchpad to pivot into advanced sub-fields, such as data science, machine learning engineering, business intelligence architecture, or product management.
How to Get Started: A Practical Learning Roadmap
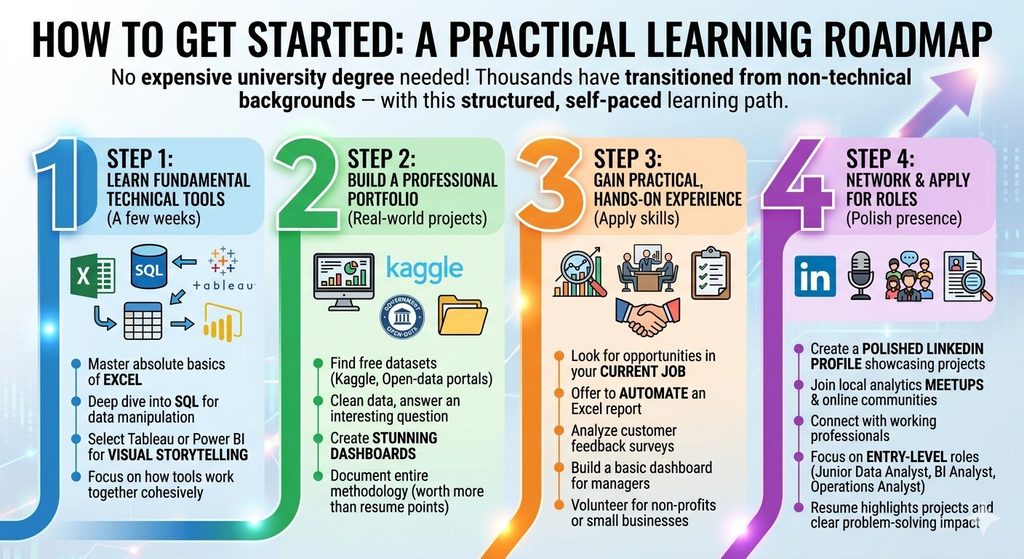
You do not need a expensive, four-year university degree in computer science or mathematics to successfully break into this high-demand career field. Thousands of professionals have successfully transitioned from completely non-technical backgrounds by following a structured, self-paced learning path.
Step 1: Learn the Fundamental Technical Tools
Dedicate a few weeks to mastering the absolute basics of Microsoft Excel, followed by a deep dive into structured query language (SQL). Once you feel comfortable extracting and manipulating data, select either Tableau or Power BI to learn the art of visual storytelling. Focus on understanding how these tools work together cohesively.
Step 2: Build a Professional Portfolio
An impressive portfolio of real-world projects is worth far more to a hiring manager than a bullet point on a resume. Find free, publicly available datasets on platforms like Kaggle or government open-data portals. Clean the data, perform an analysis to answer an interesting question, create a stunning dashboard, and document your entire methodology.
Step 3: Gain Practical, Hands-on Experience
Look for opportunities to apply your new skills in your current job, even if your official title isn’t analyst. Offer to automate an Excel report for your team, analyze customer feedback surveys, or build a basic dashboard for your manager. If that isn’t possible, consider volunteering your services to local non-profits or small businesses that need help organizing their data.
Step 4: Network and Apply for Roles
Create a polished LinkedIn profile showcasing your portfolio projects. Join local analytics meetups, participate in online data communities, and connect with working professionals in the field. When applying for entry-level roles, focus on positions like Junior Data Analyst, Operations Analyst, Business Intelligence Analyst, or Marketing Analyst, ensuring your resume highlights your practical projects and your clear problem-solving impact.
Conclusion: Embrace a Future-Proof Career Today
In summary, data analytics is far more than a passing corporate trend or a temporary tech buzzword. It represents a fundamental shift in how the modern world operates, experiments, and grows. By learning to harness the immense power of raw information, you equip yourself with a highly versatile, future-proof skill set that is desperately needed by organizations all across the globe.
Whether you are a recent university graduate looking for an exciting first job, or an experienced professional seeking a meaningful career pivot, the field of analytics offers a clear, accessible, and deeply rewarding path forward. All it takes to begin is a curious mind, a dedication to consistent learning, and the willingness to take that first step. Open up a spreadsheet, download a dataset, and start uncovering the hidden stories written in the data today.
Frequently Asked Questions About Data Analytics
1. Why Does Data Analytics Matters?
The primary goal of data analytics is to examine raw datasets to find trends, answer critical questions, and extract meaningful insights. By converting unstructured numbers into clear patterns, data analytics allows organizations to make logical, evidence-based business choices instead of relying on simple intuition.
2. Can I learn data analytics without a degree?
Yes, you can absolutely build a career in data analytics without a formal computer science or statistics degree. Many entry-level professionals break into the field by utilizing specialized online certificates, intensive bootcamps, and building a structured personal portfolio that showcases practical data analytics projects.
3. How Data Science goes Beyond Data Analytics?
While both fields work with large volumes of information, they have distinct goals:
- Data Analytics: Focuses on examining historical data to solve specific, existing business questions and find actionable trends.
- Data Science: Focuses on building new algorithms, designing predictive models, and writing machine learning code to anticipate future possibilities.
4. Which and How much languages are used in data analytics?
The two most prominent programming languages utilized in data analytics are SQL (Structured Query Language) for extracting information from databases, and Python or R for cleaning, manipulating, and performing advanced statistical calculations on complex datasets.
6. How much math is required for entry-level data analytics roles?
You do not need to be an expert in advanced calculus or linear algebra for most entry-level data analytics positions. A foundational understanding of descriptive statistics such as mean, median, mode, standard deviation, variance, and basic probability is completely sufficient to start.
7. Do I need a coding background to start a career in data analytics?
No. You can start with Excel and SQL, which are beginner-friendly. Python or R can come later, and many people learn them while working.
8. Which skills should a beginner learn first for data analytics?
Start with Excel, SQL and basic statistics. Then add a visualization tool such as Power BI or Tableau, and learn Python for larger datasets. Clear communication matters too, because analysts must explain what the data means.
9. What Jobs can I get after learning data analytics?
Common entry-level roles include Data Analyst, Business Analyst, Reporting Analyst and Junior BI Analyst. With experience, you can move towards Data Scientist, Analytics Manager or Data Engineer roles.
10. How long does it take to learn data analytics?
With regular practice, most beginners can learn the core skills in about 4 to 8 months. This varies with your starting level and the time you give each day. Building real projects matters more than finishing courses.
11. How can I build a portfolio as a beginner in data analytics?
Pick public datasets and answer simple business questions, such as sales trends or customer behavior. Show the results in dashboards or short reports and publish them on GitHub or a personal site. Employers value projects more than certificates alone.